QuantJourney Backtester

QuantJourney Backtester

Share product feedback

✓

Thank you.

Your note is now in the QuantJourney inbox.

Open engine · Commercial PRO · Enterprise / Private

Backtests are easy Defensible research is hard

Open-source backtesting with realistic execution, robust validation and reproducible research. Add PRO for managed data and advanced research workflows, or discuss Enterprise / Private for dedicated environments and team support.

Apache 2.0· Local compute· Your strategy code stays on your machine

Weight-based
Order-based
Walk-forward Optuna optimization
Risk metrics
Tear sheets
Sample data
PIT-ready
Transaction costs
Reproducible runs

Build and test strategies locally

Start from 50 runnable examples or your own Python logic across long/short equities, spot FX and futures. Choose weight or order mode, configure indicators, rebalancing, risk and execution costs, then inspect NAV, holdings, trades, metrics and plots on your machine. Borrow, financing, margin and futures-roll assumptions require explicit modeling where relevant.

See asset-class modeling assumptions → Start with a free example →

Standardize how research is reviewed

Move from isolated scripts to one explicit standard for data provenance, point-in-time inputs, timing, costs, validation and reports. The engine records the declared contract; users remain responsible for the temporal correctness of custom inputs. The hosted workspace is designed to add team access, run history and shared review artifacts when collaboration matters.

Preview research workspace →

Start in under 3 minutes

Clone the full repository or add the same engine directly to your Python workflow.

GitHub
Source, tests, strategies and examples included.
$ git clone https://github.com/QuantJourneyOrg/quantjourney-bt.git
Python Package
Install into any Python project with pip.
$ pip install quantjourney-bt

Built for quants & researchers

From idea to evidence. Traceable by design.

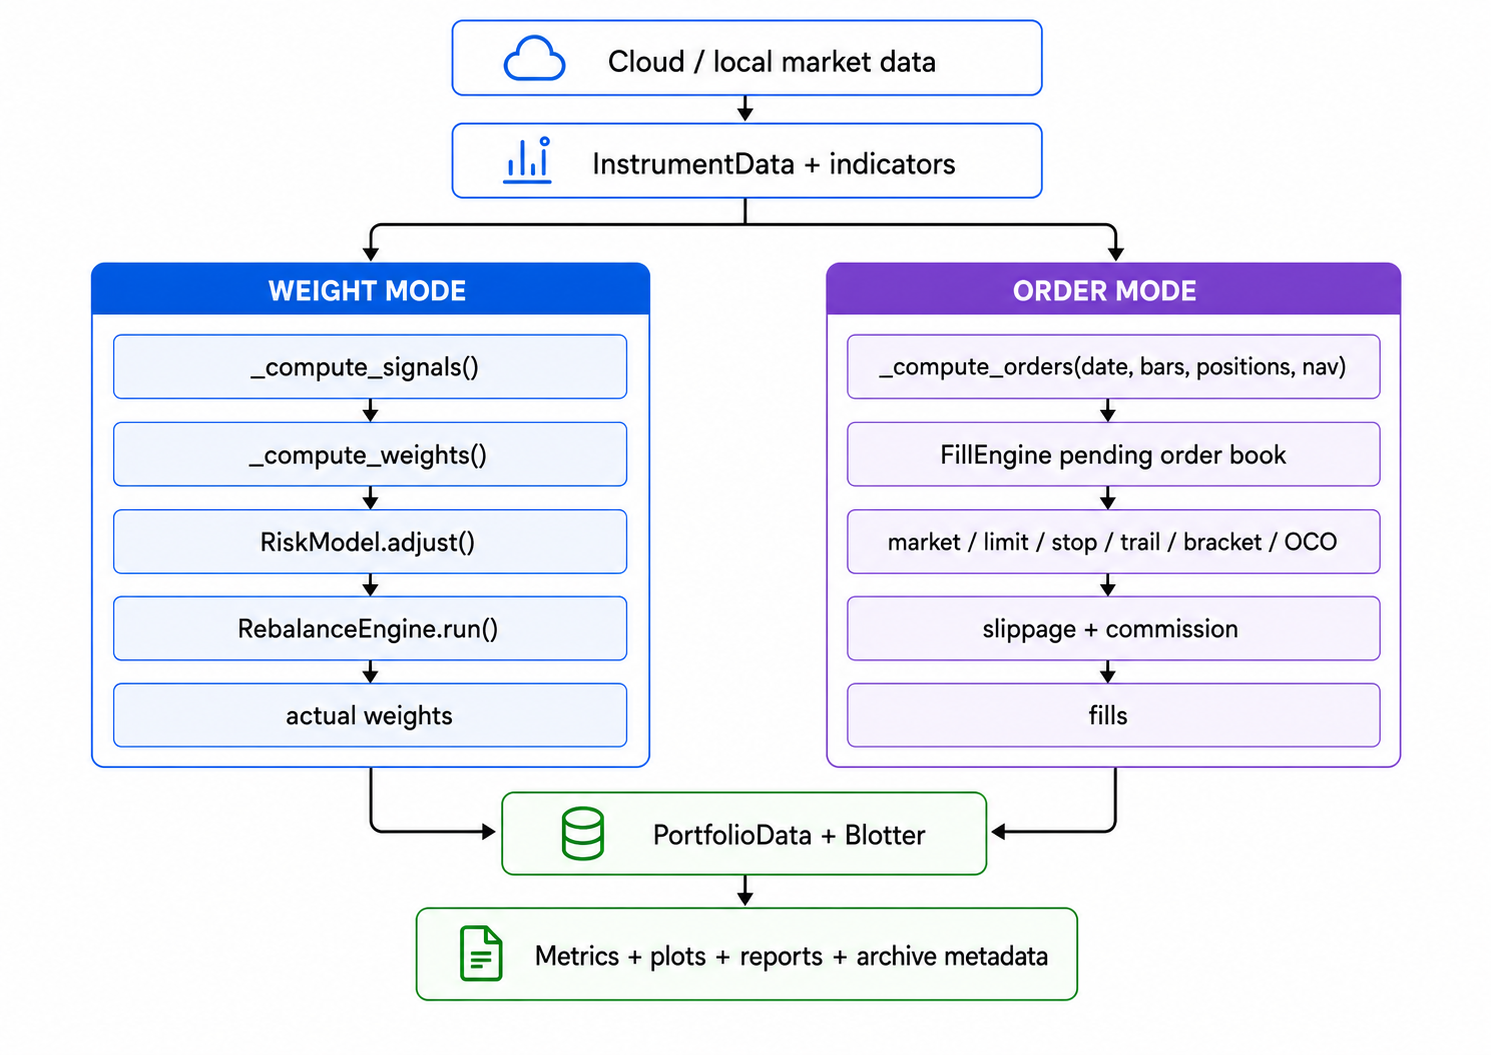
QuantJourney strategy modes architecture from research idea to portfolio evidence

Prototype signals

Build DataFrame/NumPy signal and weight paths across dates and instruments.

Validate execution

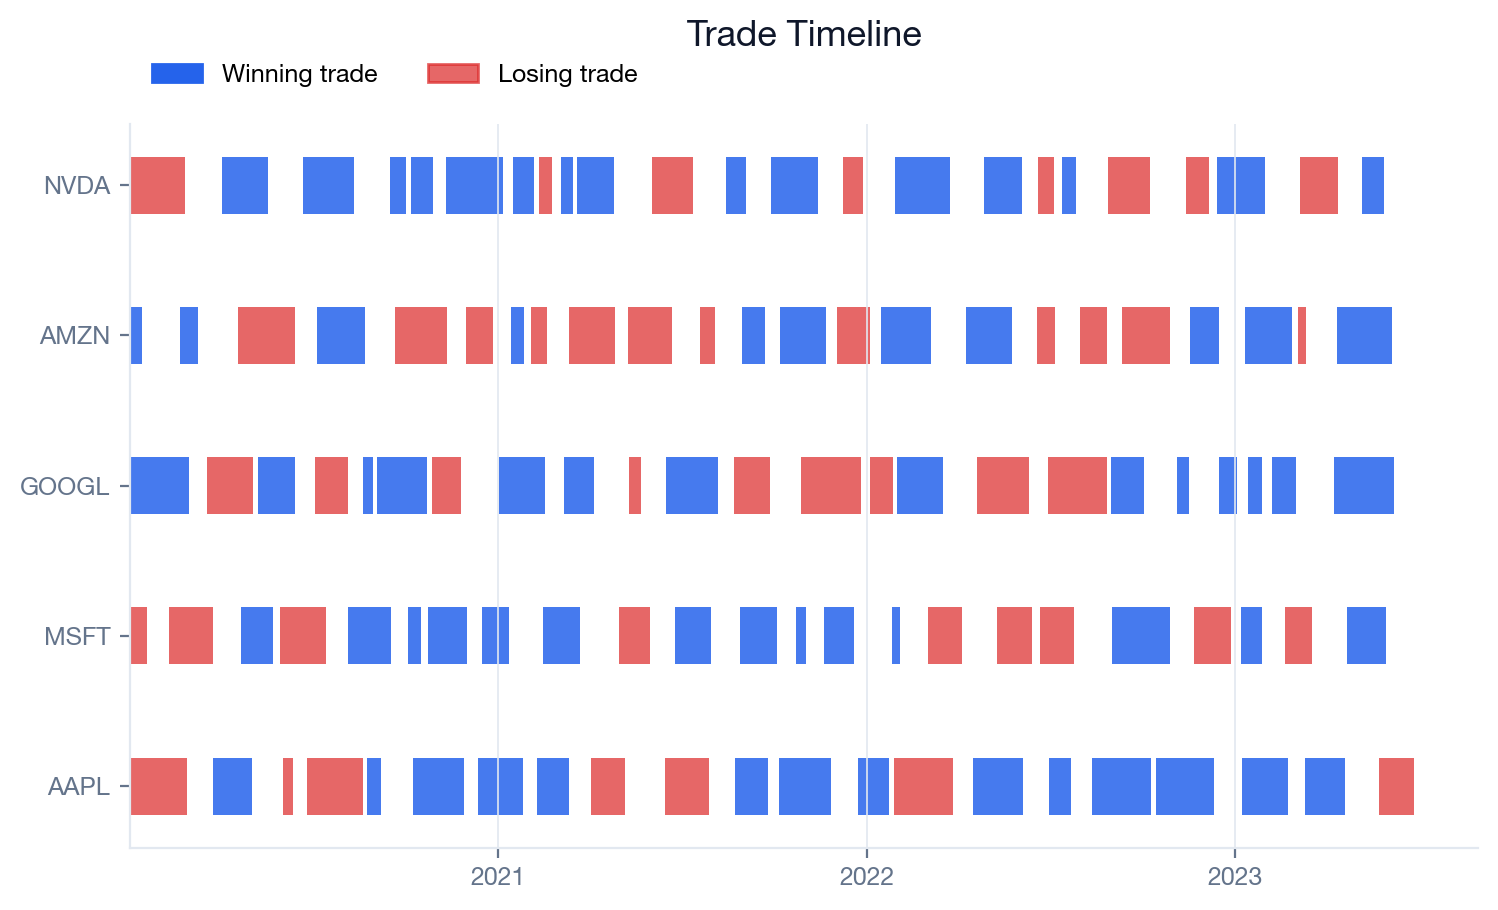
Replay orders, fills, slippage and costs when weights are not enough.

Search parameters

Run Optuna trials across numeric and categorical spaces with evidence.

Build out-of-sample evidence

Use rolling and expanding walk-forward folds before trusting a tuned run.

Stress regimes

Inspect drawdowns, crisis windows, volatility regimes and failure periods.

Publish packets

Export metrics, plots, artifacts and PDF tear sheets from one documented run.

Choose how you use QuantJourney Backtester

Open runs locally today. PRO is commercially available with managed research data and advanced workflows. The hosted workspace is coming soon. Enterprise / Private scope is agreed with your team. Walk-forward validation and optimization are also available in the open engine.

01

Open

Run the engine locally.

Apache 2.0 backtesting with deterministic sample data, realistic execution, validation and optimization on your own machine.

Available now

Get started on GitHub →
02

PRO

Research with managed data and advanced workflows.

Managed market and fundamental data, advanced validation and optimization workflows. Data coverage, licensing and access are agreed during onboarding.

Commercially available. Hosted workspace coming soon.

Request PRO access →
03

Enterprise / Private

Dedicated research infrastructure for your team.

Dedicated data, environments, team workflows and support, scoped around your investment process.

Deployment, capabilities and timing agreed with your team.

Discuss Enterprise / Private →

Why teams choose QuantJourney Backtester

Realistic accounting

Accurate cash & positions, corporate actions, financing, and costs. Built for institutional-grade analysis.

Reproducible research

Deterministic data, pinned environments, and reproducible runs you can trust and share.

Optimization & walk-forward

Optuna-powered optimization with walk-forward validation to avoid overfitting and measure robustness.

Institutional diagnostics

Comprehensive metrics, attribution, exposures, and tear sheets ready for decision making.

Two ways to write a strategy

Start with vectorized portfolio research or move to order-aware EOD simulation when execution logic matters.

Weight Mode

Portfolio research for allocation strategies. Signals become target weights across a portfolio. Best for factor, ranking, rotation and scheduled rebalancing.

from backtester import Backtester

class SMACrossover(Backtester):
    def _compute_signals(self):
        close = self.instruments_data.get_feature("adj_close")
        fast = close.rolling(50).mean()
        slow = close.rolling(200).mean()
        return (fast > slow).astype(float).fillna(0.0)

    def _compute_weights(self):
        signals = self.instruments_data.get_feature(
            "strategies", self.strategy_name, "signals"
        )
        active = signals == 1
        n_active = active.sum(axis=1)
        return active.div(n_active, axis=0).fillna(0.0)

strategy = SMACrossover(
    instruments=["AAPL", "MSFT", "GOOGL", "AMZN", "NVDA"],
    backtest_period={"start": "2015-01-01", "end": "2025-01-01"},
    initial_capital=100_000,
    execution_mode="weights",
)

Order Mode

EOD execution for trade-aware strategies. Use orders, sizing, stops, take-profit and brackets when execution behavior matters.

from backtester import Backtester

class BracketTrendEntry(Backtester):
    def _compute_signals(self):
        close = self.instruments_data.get_feature("adj_close")
        sma_200 = close.rolling(200).mean()

        return (close > sma_200).astype(float).fillna(0.0)

    def _compute_orders(self, date, bars, current_positions, nav):
        self.bracket_percent(
            "AAPL",
            weight=0.20,
            take_profit=0.10,
            stop_loss=0.05,
        )

strategy = BracketTrendEntry(
    instruments=["AAPL"],
    backtest_period={"start": "2020-01-01", "end": "2025-01-01"},
    initial_capital=100_000,
    execution_mode="orders",
)
Backtest examples

One run. Full research packet.

These are concrete outputs from the backtester: equity curves, drawdown, seasonality, crisis summaries, parameter diagnostics and walk-forward results.

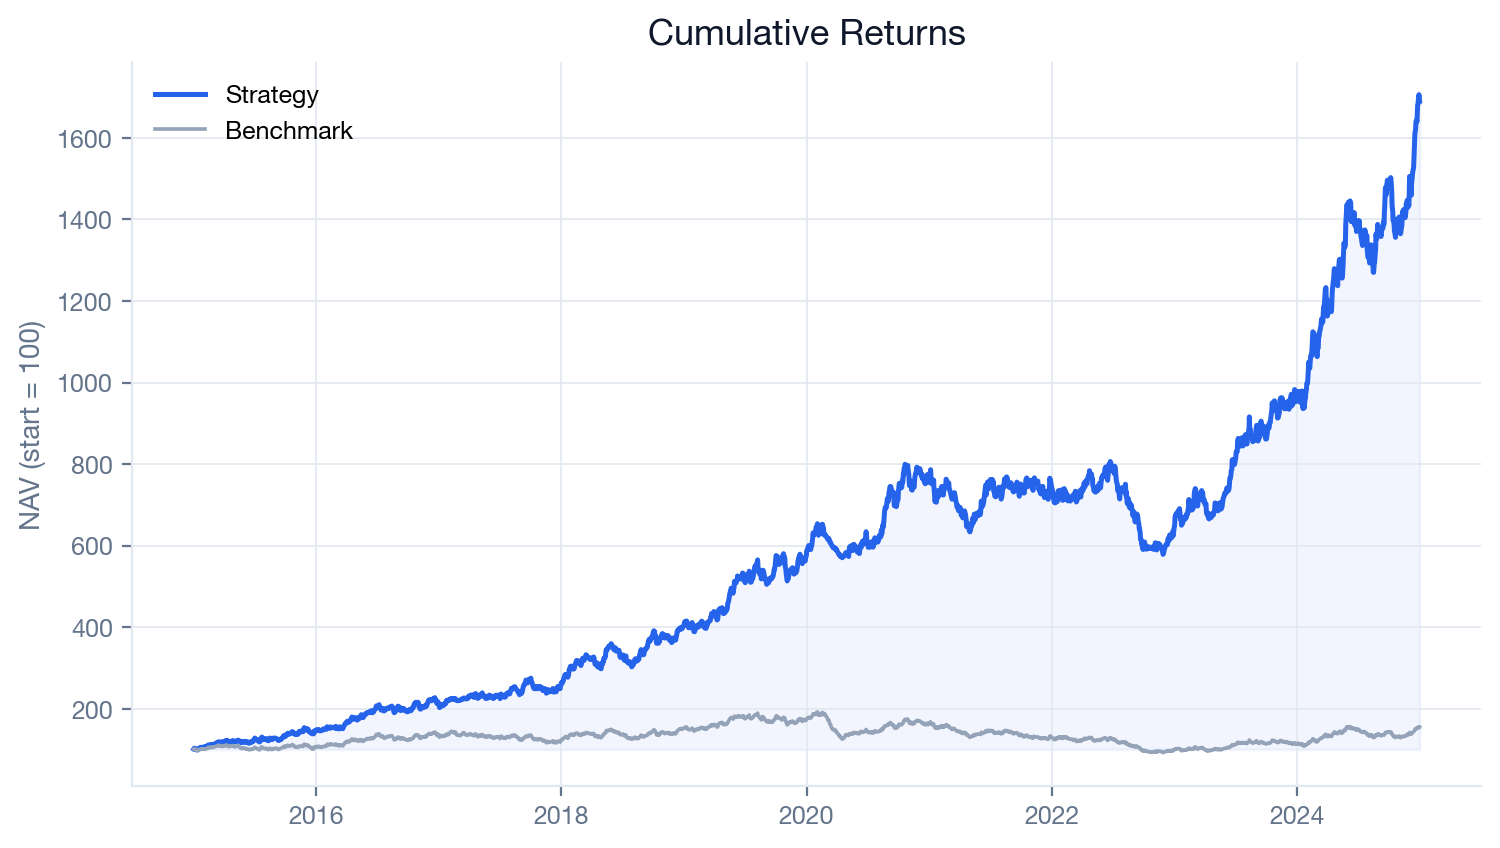
Strategy equity curve versus benchmark

1. Performance & benchmark

Compare strategy path, benchmark curve, cumulative return and terminal capital.

EquityBenchmark
Open example ->
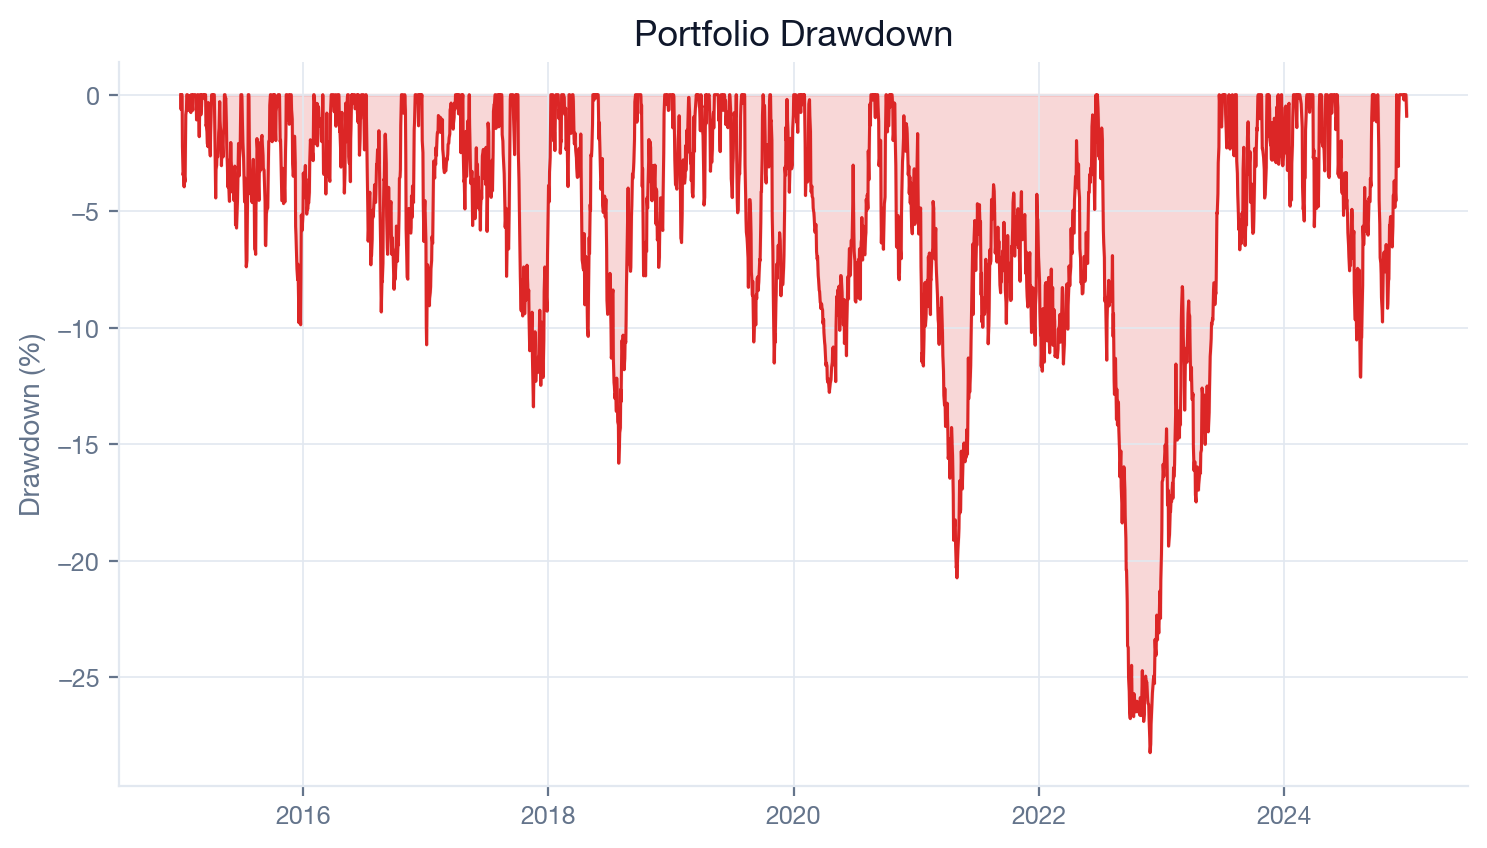
Portfolio drawdown chart

2. Drawdown / underwater risk

Inspect underwater periods, recovery path, max drawdown and risk-adjusted return.

RiskDrawdown
Open example ->
Monthly returns heatmap

3. Seasonality heatmap

Turn return history into a calendar structure for month and regime review.

ReturnsCalendar
Open example ->
Crisis response summary

4. Crisis response

Stress the strategy across crashes, macro shocks, recoveries and volatile episodes.

StressCrisis
Open example ->
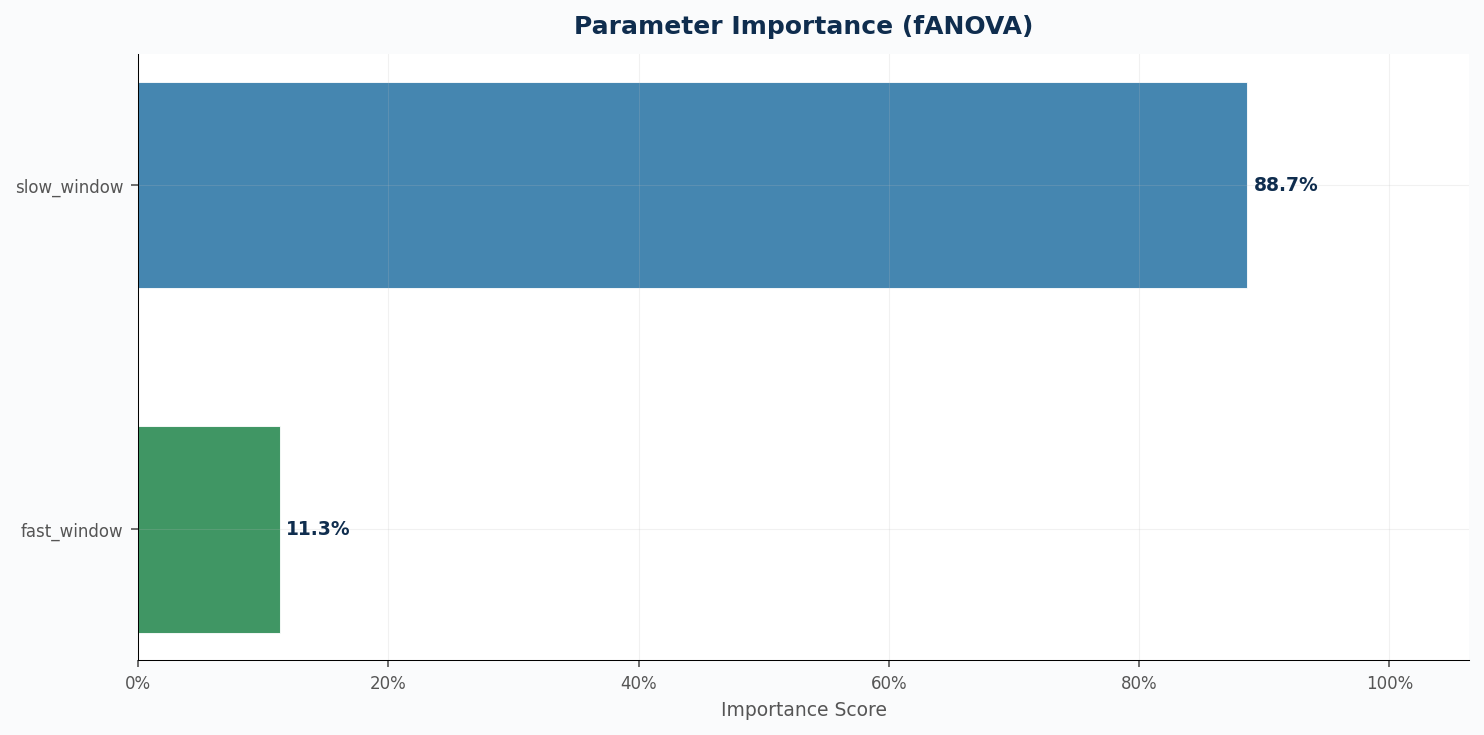
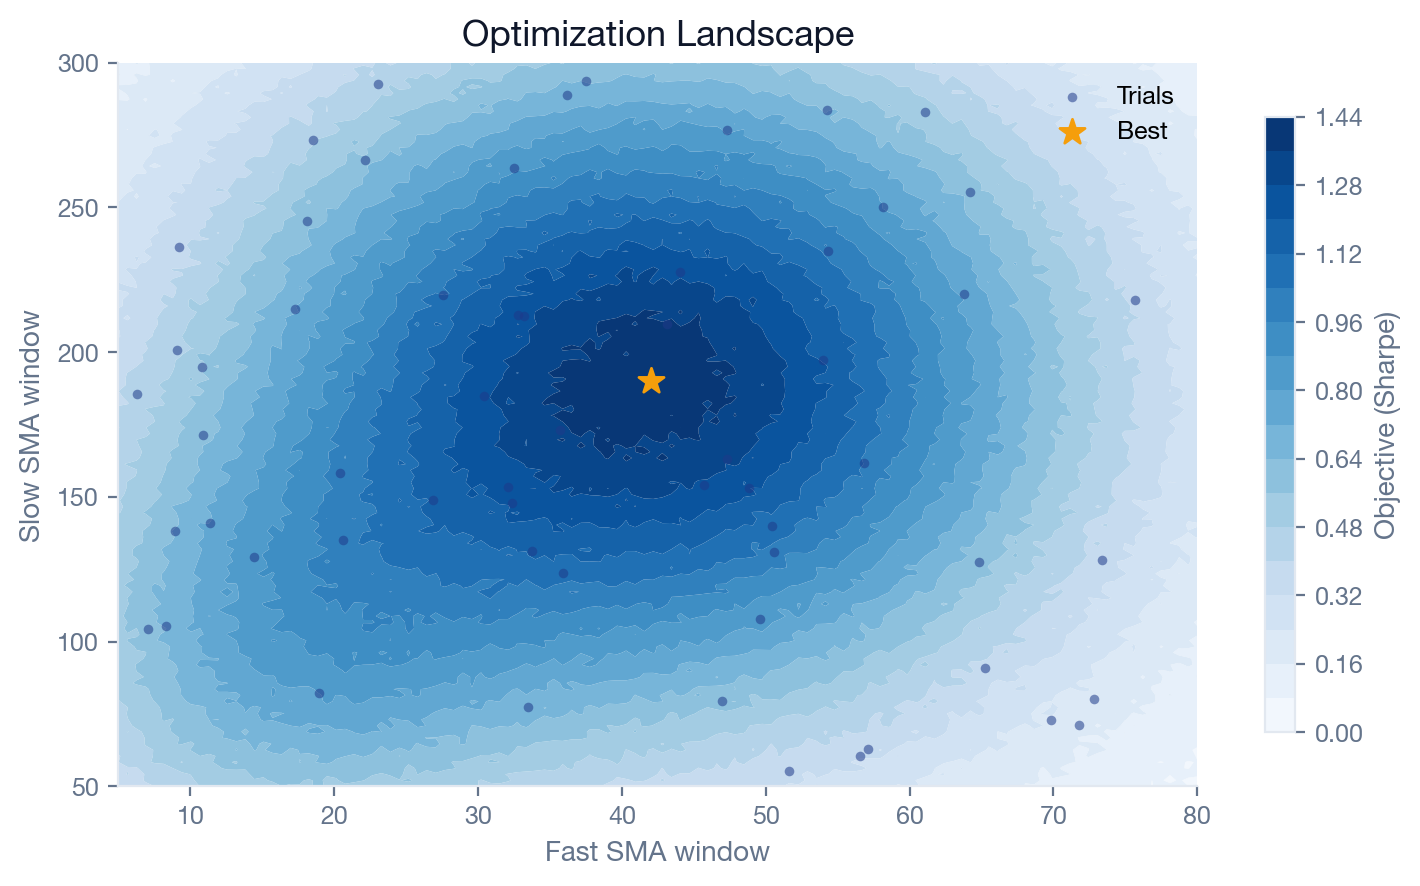
Parameter importance chart

5. Parameter evidence

See which assumptions drive objective value before promoting a tuned configuration.

OptunaSearch
Open example ->
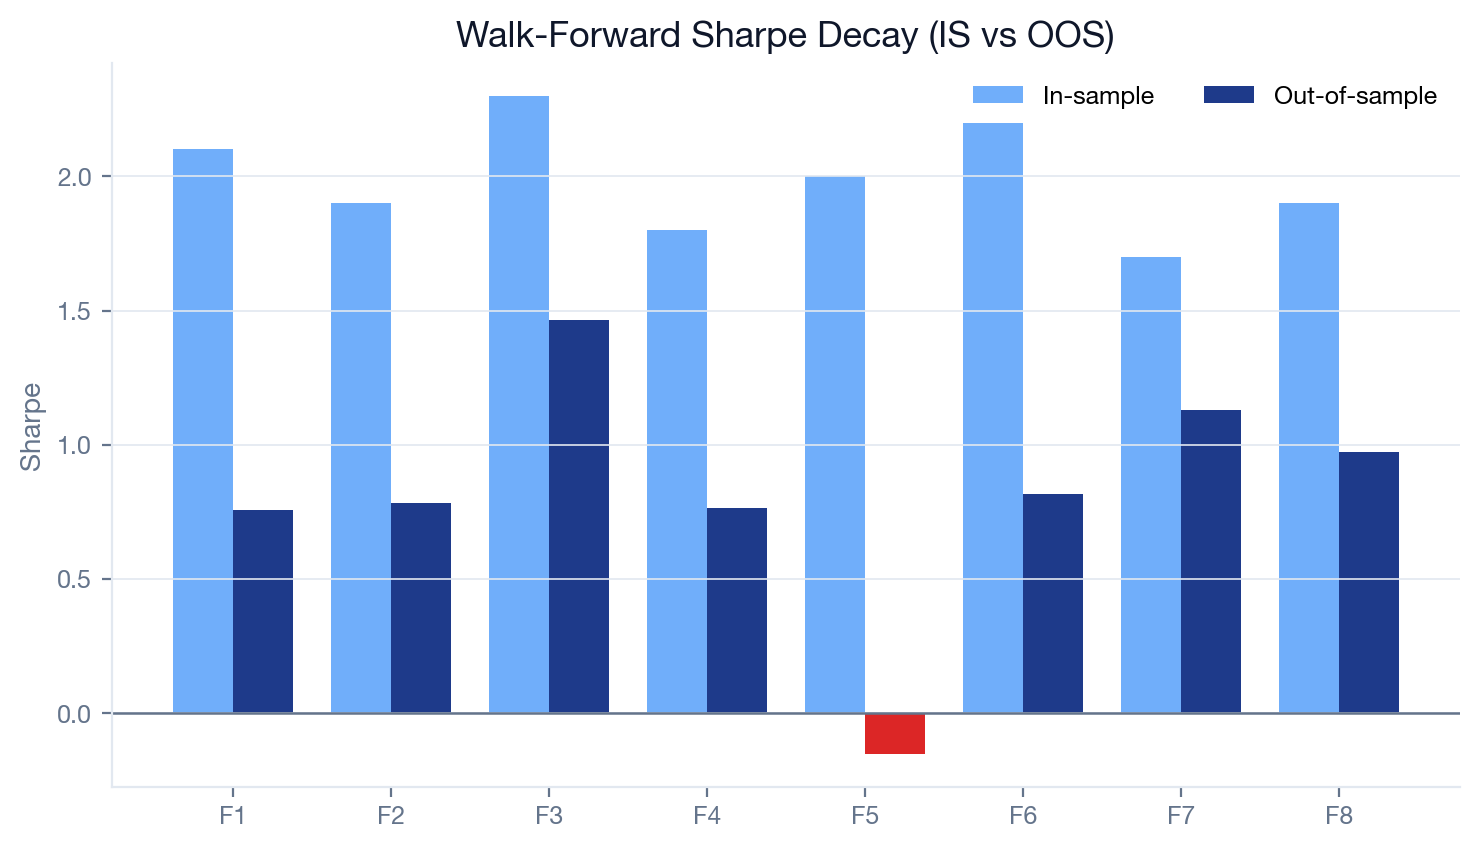
Walk-forward out-of-sample equity curve

6. Walk-forward OOS

Separate in-sample tuning from out-of-sample behavior with fold-level evidence.

WFOOS
Open example ->

More than charts: a review packet.

Cumulative returns with benchmark regimes

Regime-aware performance

Overlay portfolio path with bull, bear and sideways market regimes.

RegimeEquity
Relative performance versus benchmark

Active return path

Inspect where the strategy adds or loses value versus the benchmark.

ActiveBenchmark
Drawdown recovery analysis

Recovery duration

Measure how long drawdowns persist, not only how deep they get.

RecoveryDrawdown
Rolling VaR and CVaR chart

Rolling tail risk

Track VaR and CVaR through regimes before approving a configuration.

VaRCVaR
Turnover versus performance scatter plot

Turnover evidence

Check whether additional trading activity is actually buying performance.

TurnoverCosts
Asset contribution to portfolio risk

Risk contribution

See which instruments are driving portfolio risk in the final packet.

RiskExposure

The same run writes an 80+ metric table across executive summary, performance, benchmark comparison, risk, market dynamics, trading analytics, execution context, reproducibility and crisis behavior.

80+ metrics, grouped like a research memo.

The console table is organized for review: headline performance, benchmark-relative behavior, downside risk, trade analytics, reproducibility and crisis response.

View full metric dictionary ->
Executive Summary
CAGR 32.01%
Net Profit $1,505,653
Sharpe 1.30
Max DD -27.12%
Risk Metrics
VaR 95% 2.02%
Expected Shortfall 4.30%
Tracking Error 15.05%
Worst Loss 11.98%
Trading Analytics
Win Rate 82.64%
Profit Factor 9.68
Total Trades 9,349
Turnover 155.28%
Reproducibility
Fingerprint 9a62fd...
Config Hash daba9e...
Data Hash 1c27a6...
Sanity Checks Warning — lot-match band

See the engine’s features in runnable strategies

The free catalog covers weight and order modes, market to OCO orders, risk models, intraday workflows, futures, FX and walk-forward optimization. Open a result and inspect its exact source.

SMA Crossover visual output
Signal-Based Beginner

SMA Crossover

simplest starter

Classic trend-following with a clean signal-to-weight conversion and report output.

7.38% CAGR0.45 Sharpe-34.68% Max DD
Momentum Rotation visual output
Weight-Based Intermediate

Momentum Rotation

portfolio weights

Ranks sector ETFs by trailing return, holds the strongest names and rebalances monthly.

0.05% CAGR-0.24 Sharpe-25.38% Max DD
RSI Mean-Reversion visual output
Order-Based Intermediate

RSI Mean-Reversion

order-aware execution

Buys oversold conditions with limit entries, exits with stops and reviews the blotter.

2.70% CAGR0.14 Sharpe-19.09% Max DD
Volatility Targeting visual output
Risk Overlay Advanced

Volatility Targeting

risk overlay

Scales exposure through time to keep the portfolio near a target volatility budget.

5.35% CAGR0.36 Sharpe-28.87% Max DD
Optuna Optimization visual output
Optimization Advanced

Optuna Optimization

parameter search

Uses Optuna TPE while separating parameter search, study diagnostics and out-of-sample validation.

TPE samplerWF validationTrial evidence
Walk-Forward Case Study visual output
Validation Deep Dive

Walk-Forward Case Study

validation / OOS

Separates slice diagnostics from date-bounded per-fold execution with rolling or anchored folds and pre-OOS purging.

Slice vs per-foldPre-OOS purgeOOS fold evidence

See what a strategy run produces

+1505.7%Total return
+32.0%Ann. return
1.30Sharpe
-27.1%Max DD
9.68Profit factor

Illustrative historical backtest from one configured research run — not live or investable performance. Results depend on the selected universe, period, data and modeled execution and cost assumptions; see the full packet for details. Past performance does not predict future results.

SMA 50/200 cumulative returns plot

Cumulative performance

Strategy and benchmark path from the same configured report window.

SMA 50/200 portfolio drawdown plot

Portfolio drawdown

Depth and duration of losses behind the headline return.

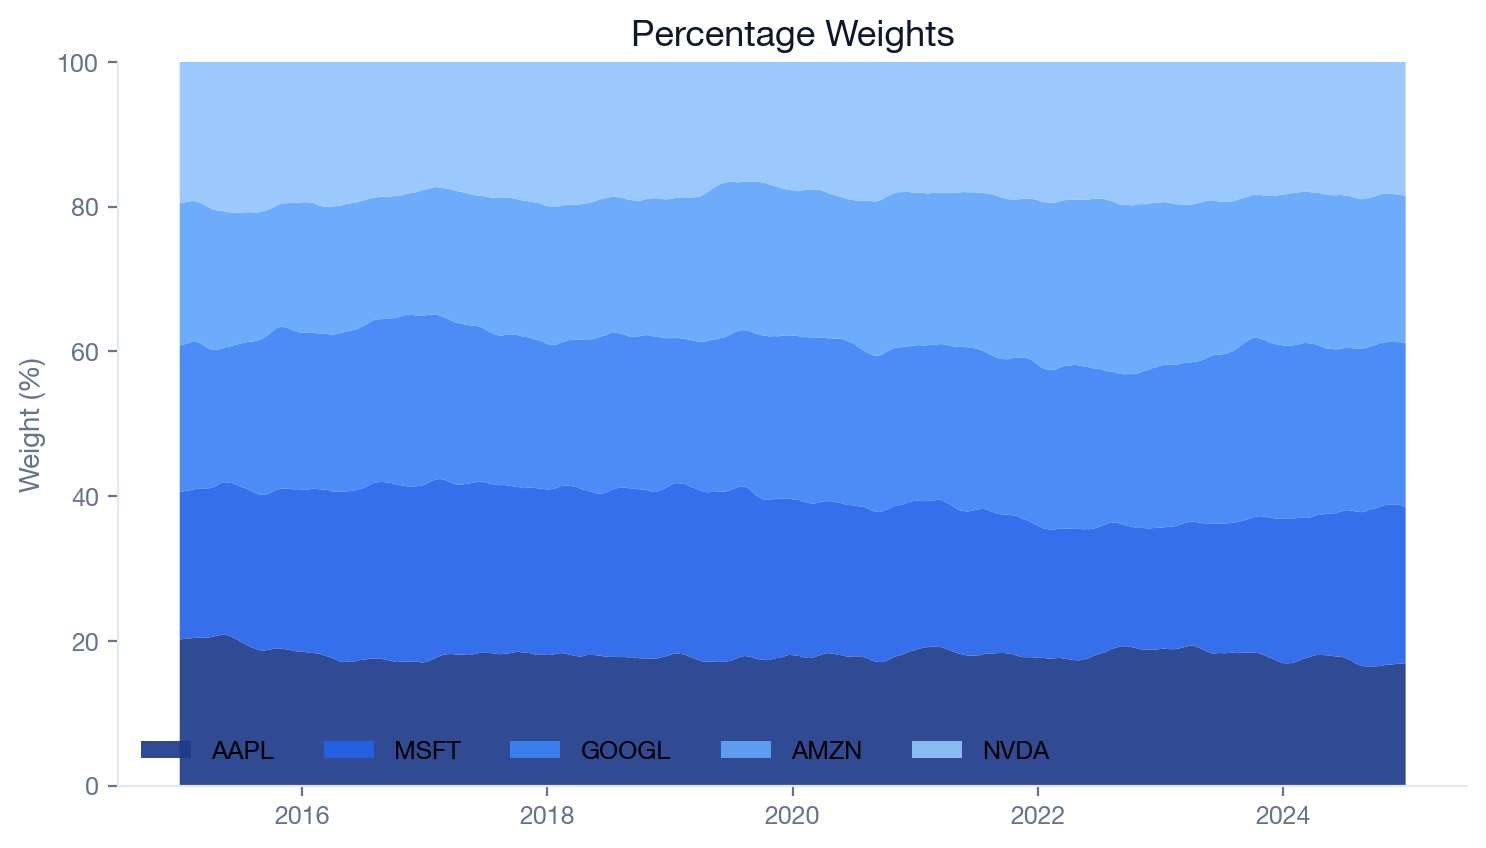
SMA 50/200 percentage weights plot

Percentage weights

Target exposure by instrument through the report window.

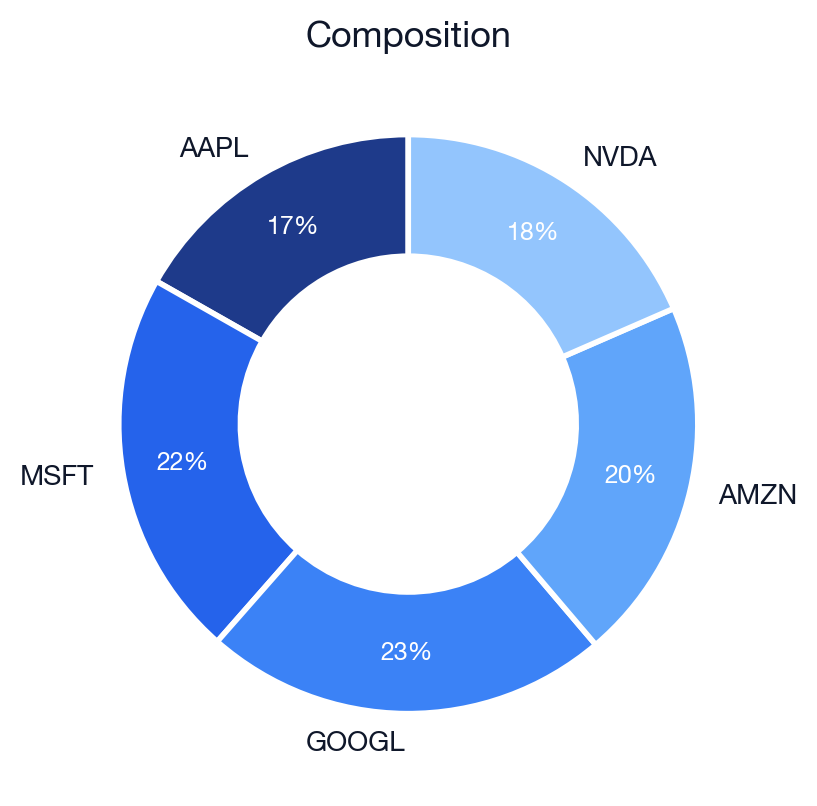
SMA 50/200 portfolio composition plot

Composition

Portfolio composition from the same generated packet.

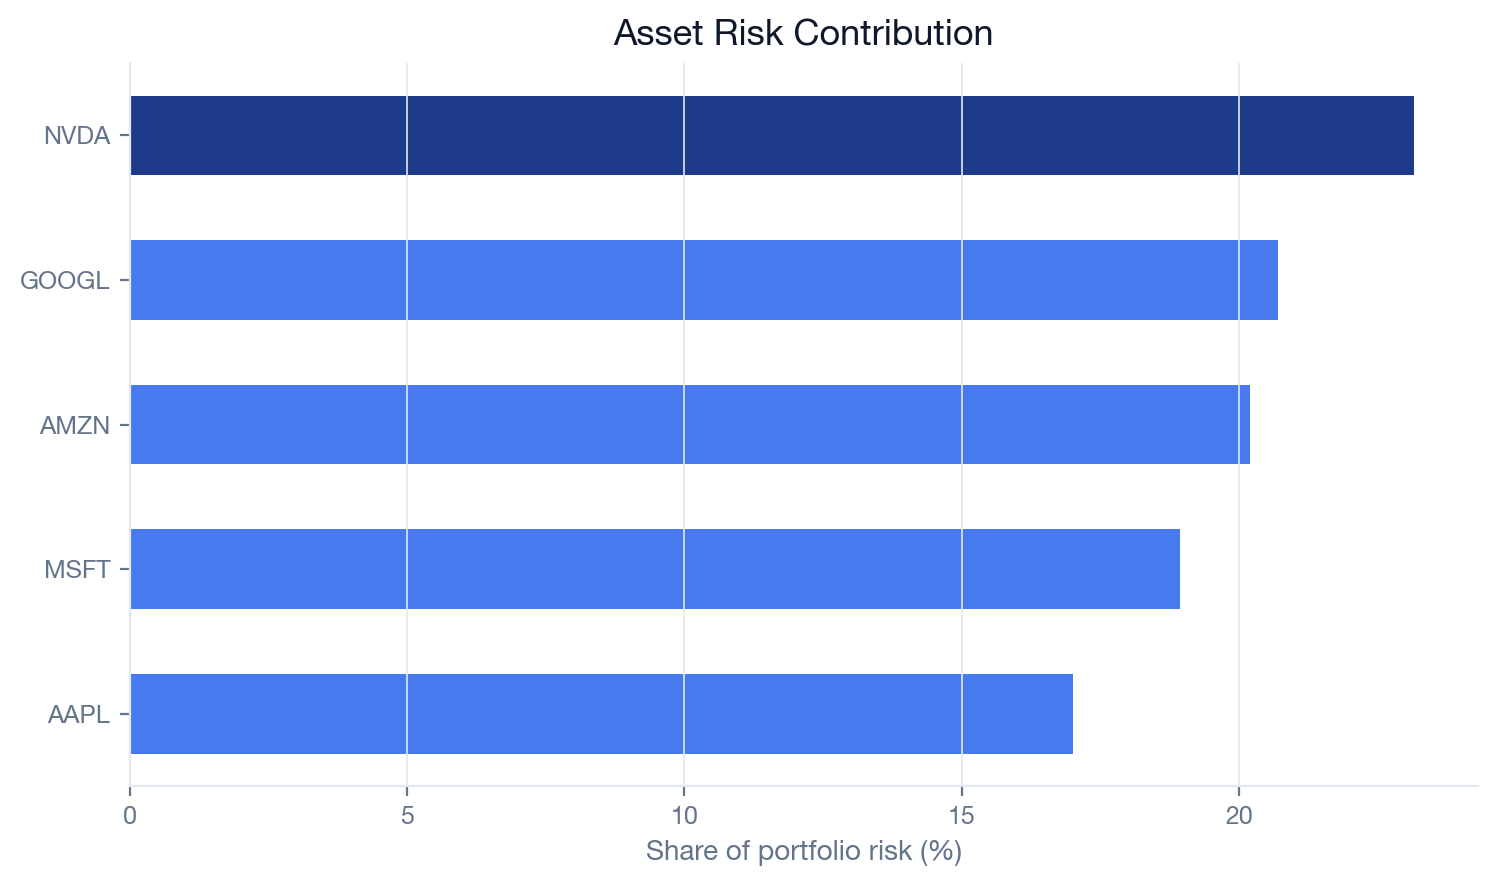
SMA 50/200 asset risk contribution plot

Risk contribution

Which assets drive portfolio risk in this run.

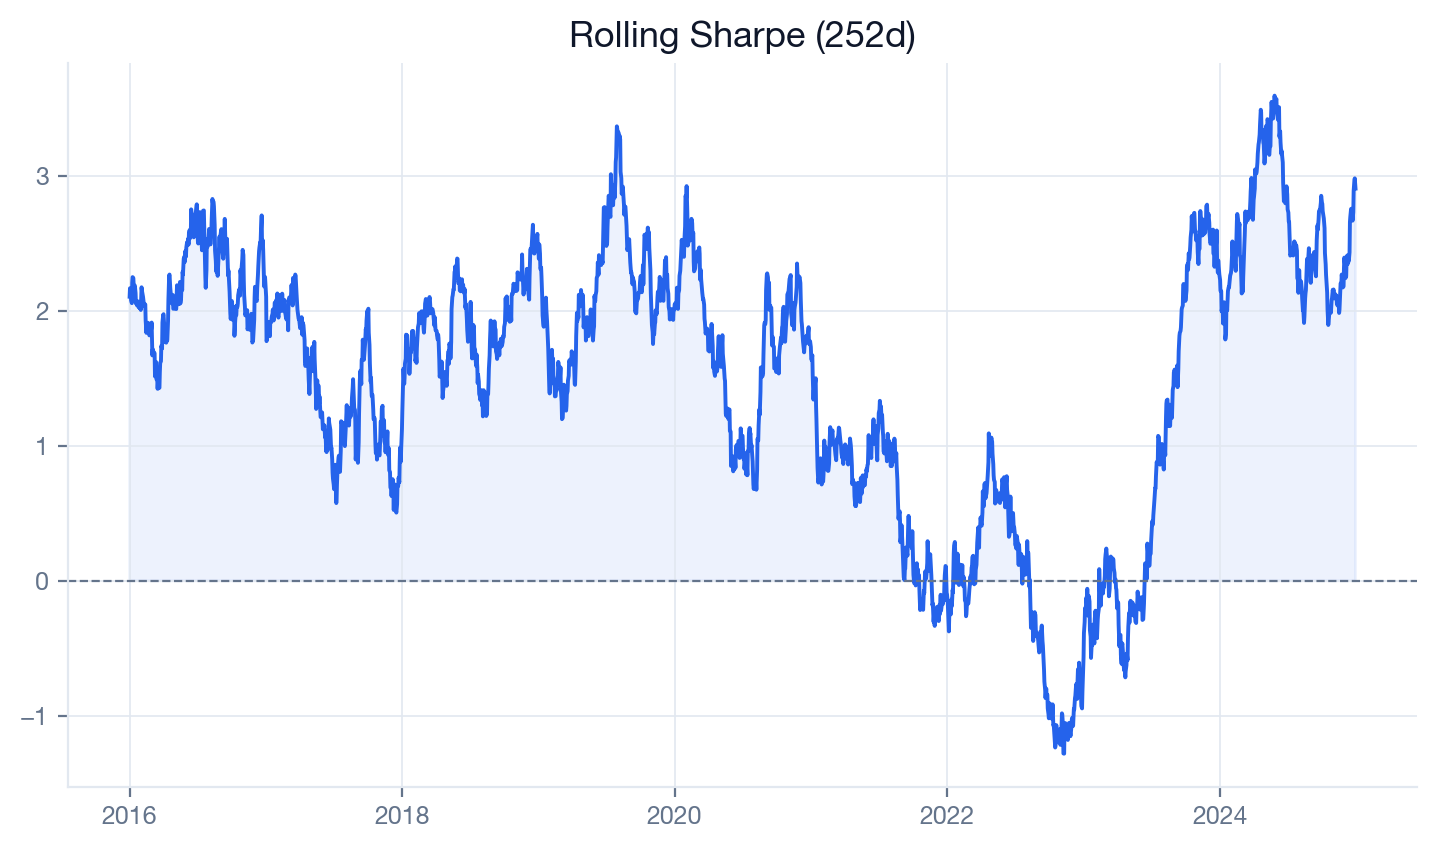
SMA 50/200 rolling Sharpe plot

Rolling Sharpe

Rolling risk-adjusted performance from the report.

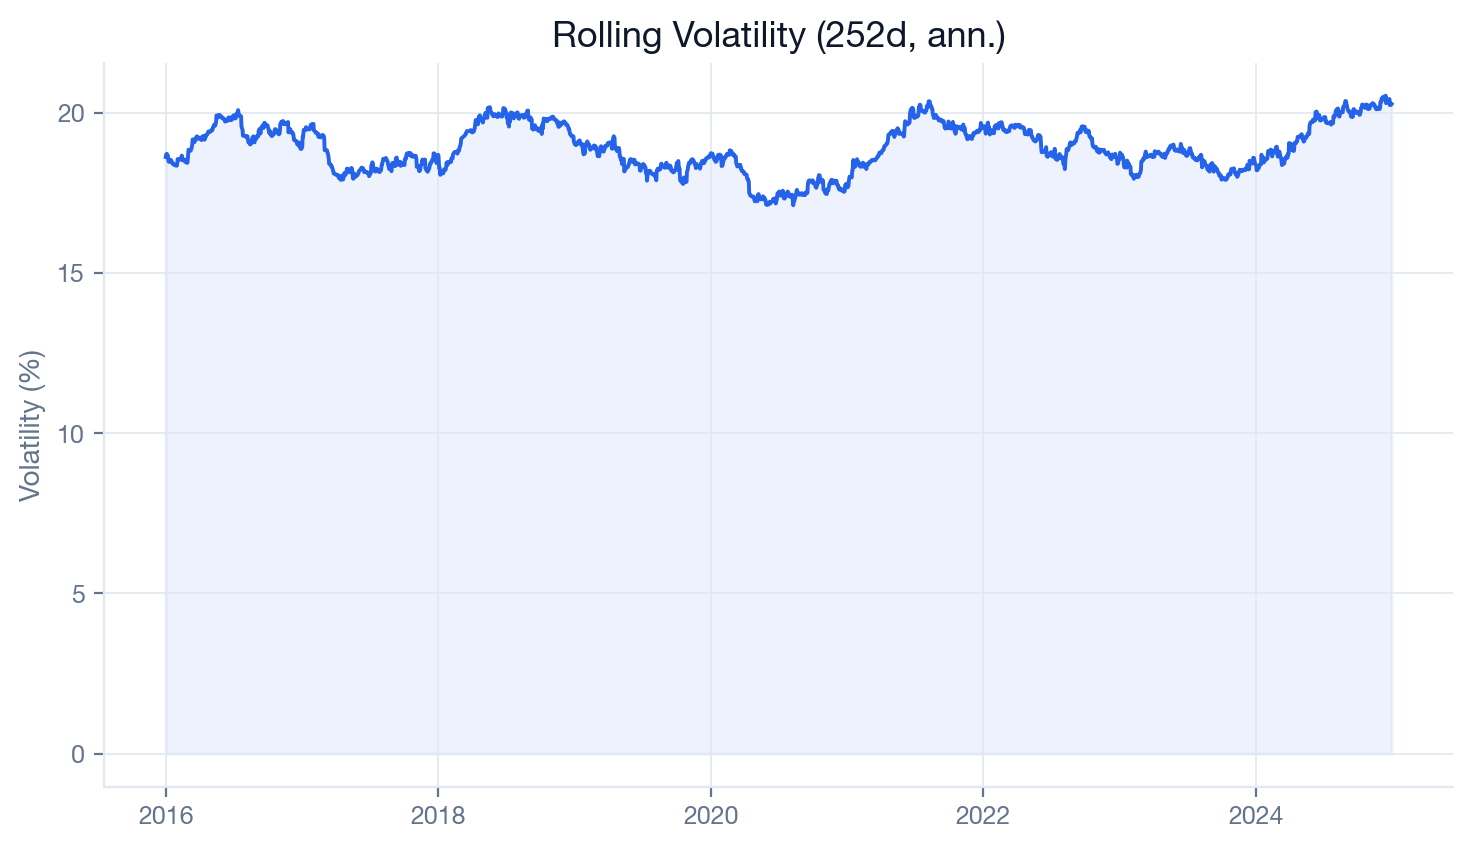
SMA 50/200 rolling volatility plot

Rolling volatility

Risk scale through time for the same run.

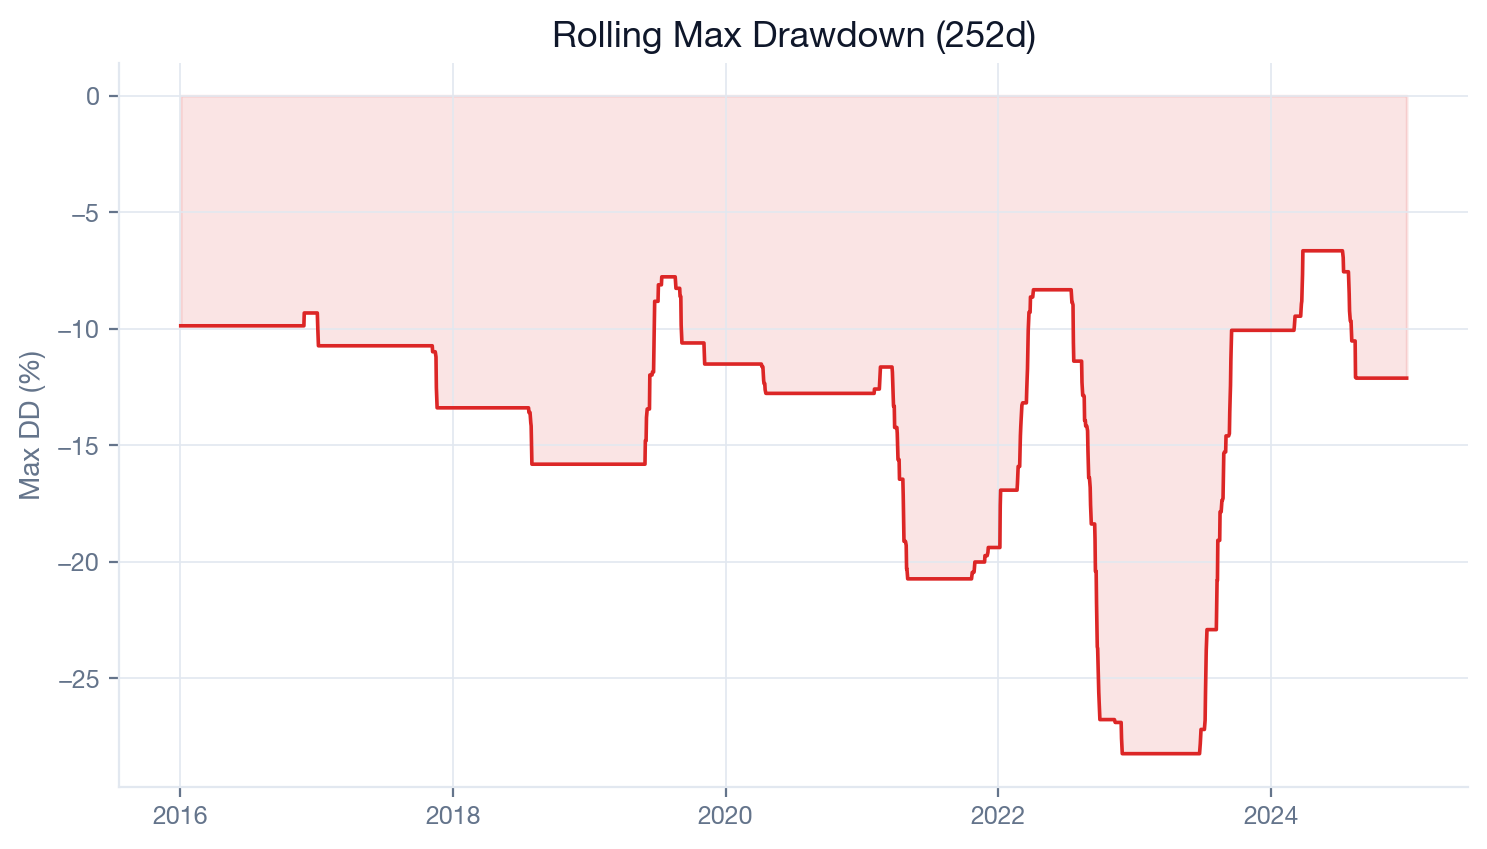
SMA 50/200 rolling max drawdown plot

Rolling max drawdown

Drawdown pressure through the report period.

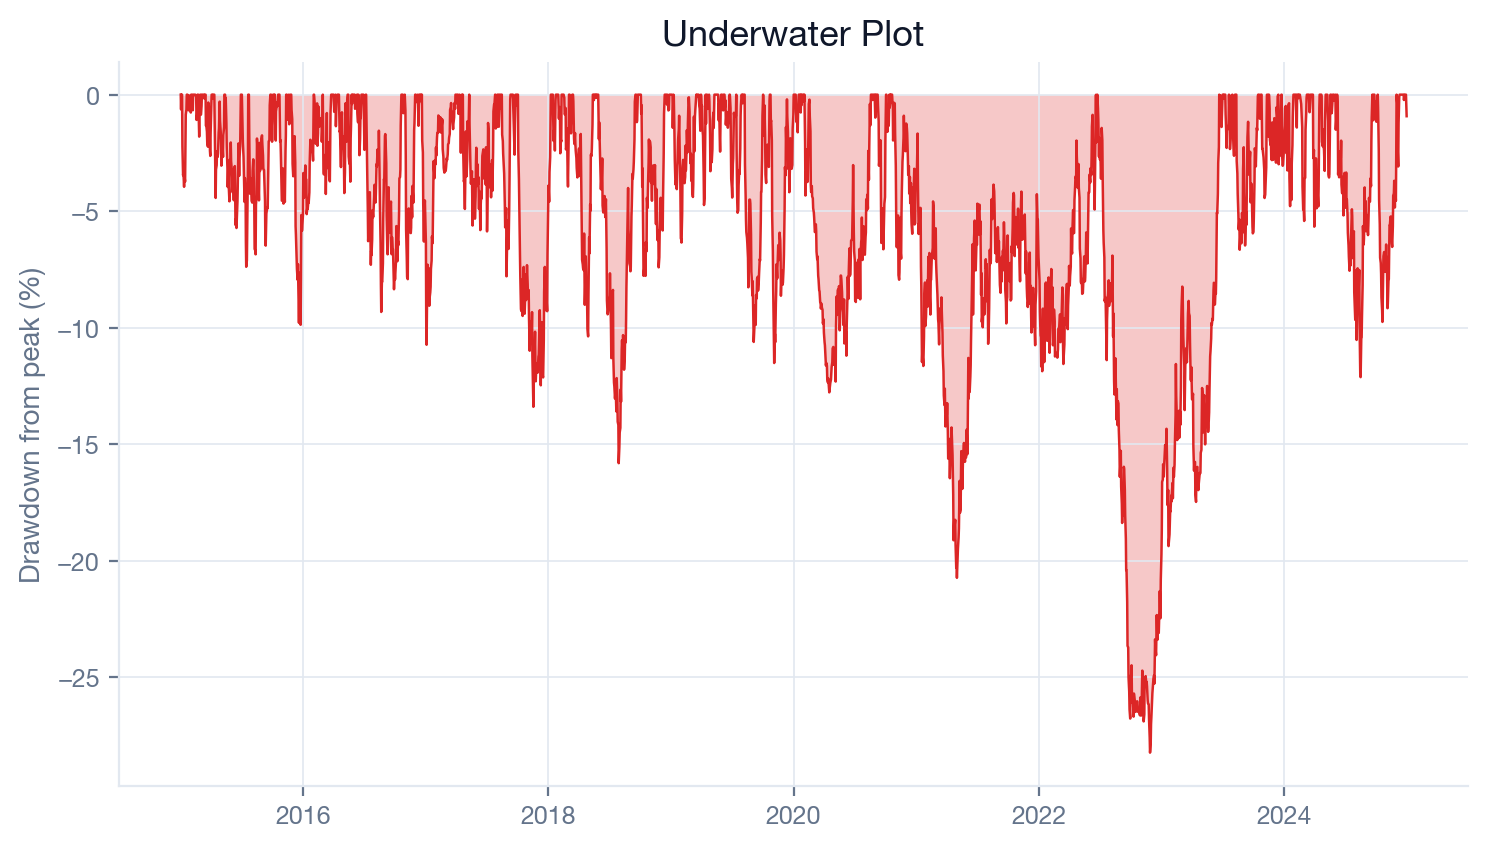
SMA 50/200 underwater plot

Underwater path

How long capital stayed below its prior high.

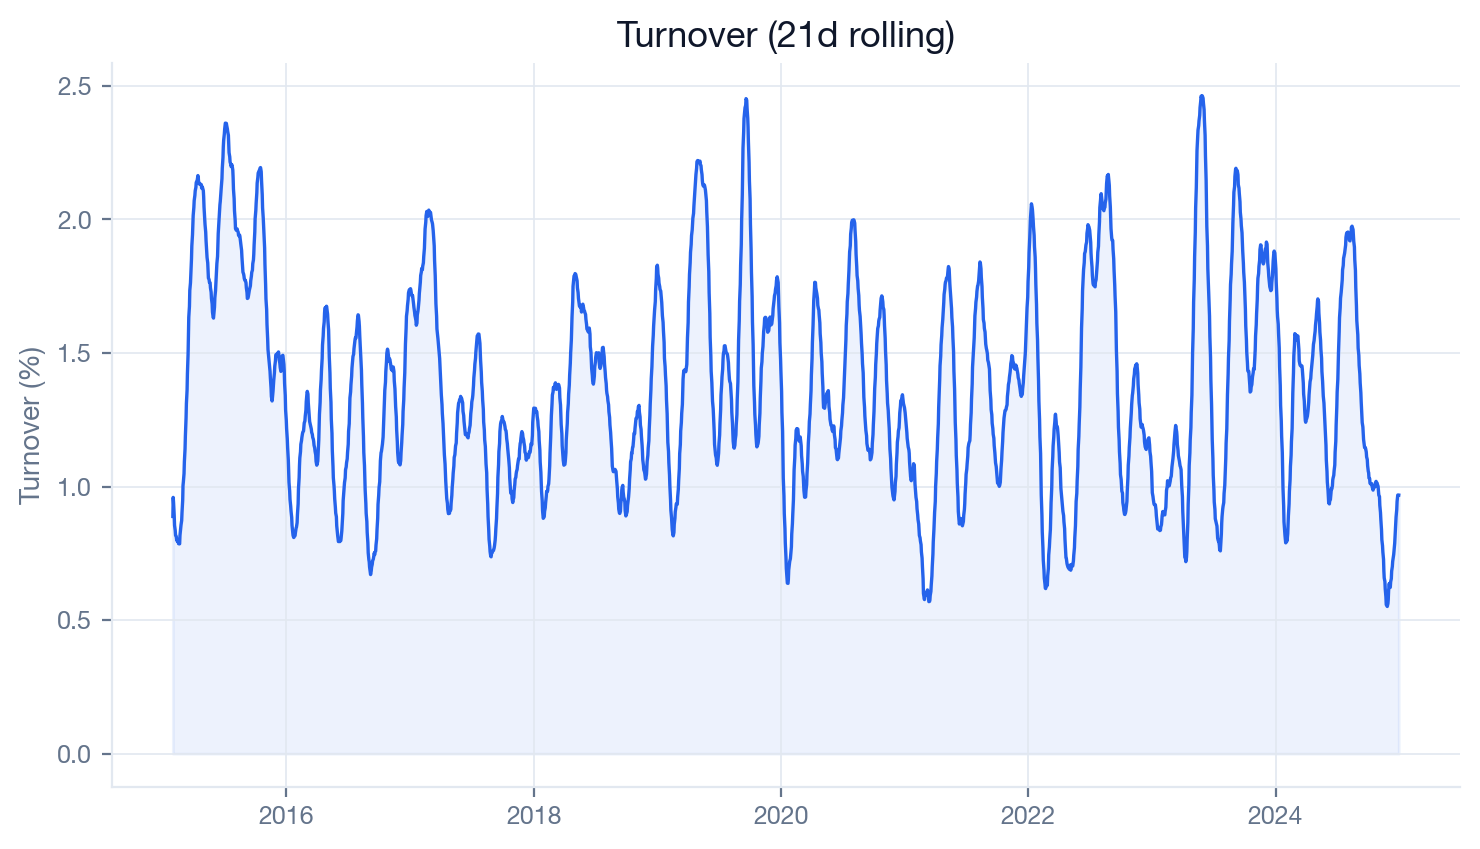
SMA 50/200 turnover plot

Turnover

Trading activity generated by the SMA order rules.

Review layer

Open-source backtesting with
the research packet built in.

Most tools make the first chart easy. QuantJourney Backtester focuses on the next question: can this strategy survive costs, regimes, validation and review?

Local first

Your alpha stays private

Data can come from Yahoo Finance, QuantJourney Cloud API or local files. Signals, weights, positions and reports are computed on your machine.

Review ready

Reports, not just curves

The open-source run produces metrics, plots, report artifacts and reproducibility metadata. Hosted and private research pipelines add full cryptographic fingerprints for code, configuration, environment and input data.

Validation

Overfit checks built in

Rolling and expanding walk-forward folds, purge gaps, Sharpe decay, deflated Sharpe and PBO measure how performance changes out-of-sample.

Execution

Weights and orders

Use portfolio weights for allocation strategies or order-based fills for stops, limits, brackets, OCO, slippage and commissions.

Comparison

What QuantJourney includes as a built-in research workflow.

Our focus is an institutional-style research review layer: overfit diagnostics, crisis analysis, declarative rebalancing and review-ready reporting. Other engines can support many of the same outcomes through extensions or custom workflow code.

FeatureQJ BacktesterVectorBTZiplineBacktraderQuantConnect
Local computeBuilt-inBuilt-inBuilt-inBuilt-inPlatform-integrated / LEAN local
Walk-forward validationBuilt-in workflowCustom workflowCustom workflowCustom workflowCustom or platform workflow
Overfit diagnostics (Deflated Sharpe, PBO)Built-in workflowAvailable through extensionAvailable through extensionAvailable through extensionCustom workflow
Crisis/regime review (20 events + 6 regimes)Built-in workflowCustom workflowCustom workflowCustom workflowPlatform-integrated reporting
Research PDF/report packetBuilt-inExternal workflowExternal workflowExternal workflowPlatform-integrated
Declarative rebalancing policiesBuilt-in workflowAvailable through core APIsAvailable through core APIsAvailable through core APIsAvailable through core APIs
Weight and order research pathsBuilt-in workflowAvailable through core APIsCustom workflowOrder-oriented coreAlgorithm/order-oriented core
Slippage and commission assumptionsBuilt-in modelsAvailable through core APIsAvailable through extensionBuilt-in modelsPlatform-integrated models
Multi-asset workflowsBuilt-in with stated assumptionsCustom by dataset/modelCustom by dataset/modelAvailable through core APIsPlatform-integrated
Open-source engineApache 2.0Open-source coreCommunity open sourceOpen sourceLEAN open source; hosted services separate

Categories describe the default research workflow, not the theoretical limits of each engine. “Custom workflow” means the outcome can be assembled with user code or third-party tooling.

Built for quants & researchers

Most backtests fail in four places.
QuantJourney checks them explicitly.

Inputs

Strategy run contract

Universe, dates, data source, benchmark, costs, execution mode and validation settings are captured before the run starts.

Basic equity curve output
Research packet

One run produces evidence across the full review surface

Execution assumptionsweights, orders, fills, slippage and commissions
Performance evidence80+ metrics, drawdowns, rolling stats and attribution
Validation recordwalk-forward folds, PBO, Sharpe decay and OOS paths
Review outputsplots, JSON, PDF tear-sheet and run metadata; full fingerprints in hosted/private pipelines
1.
SpecifyDeclare the research contract and execution model.
2.
RunGenerate positions, costs, metrics and diagnostics locally.
3.
ReviewUse the same packet for internal research, PM and governance review.
Decision support

Questions the packet answers

Does it survive costs?EX
How does performance change out-of-sample?WF
Where does it fail?CR
What metadata identifies the run?MD

Instead of a chart screenshot, the product is a portable research packet with assumptions and evidence attached.

1. Accounting failure

A signal is not exposure. A target weight is not a fill. QuantJourney separates signals, weights, orders, positions, cash and NAV so portfolio behavior is not collapsed into one misleading return stream.

2. Cost failure

Gross alpha is cheap. Net alpha is rare. Test slippage, commissions, turnover and execution assumptions before trusting the result. Borrow, financing and margin costs must currently be supplied through custom assumptions where relevant.

3. Regime failure

A strategy that works in one market can die in another. Review crisis windows, volatility regimes, drawdown recovery and benchmark-relative behavior.

4. Overfit failure

Optimized parameters are not evidence. Use walk-forward folds, purge gaps, Sharpe decay, deflated Sharpe and PBO before promoting a configuration.

Frequently asked questions

Research-integrity answers for the open-source library, the hosted workspace and QuantJourney data workflows.

Do I need a QuantJourney account or API key?

No account or API key is required to install the package, inspect the source or run the bundled deterministic sample-data mode. Included real-data workflows request data through QJ API and require enabled data access and QJ credentials, normally an API key. Backtester PRO is commercially available with managed research data and advanced workflows. Dataset coverage, licensing and quotas depend on your subscription.

Is the backtester really free?

Yes. The Python library is Apache 2.0 licensed and free to use, fork, modify and commercialize. Installation, source inspection and the bundled deterministic sample-data mode do not require an account. QJ-managed market data and hosted services have separate access conditions.

What is the hosted cloud UI?

The hosted workspace is coming soon. It is designed for configuring and reviewing backtests in the browser, with team access, run history and shared review artifacts. Backtester PRO is commercially available separately from this upcoming workspace.

Does QuantJourney prevent look-ahead bias automatically?

QuantJourney enforces next-bar timing in its built-in execution paths. Fast weight targets calculated on bar t become effective for the following return period, while orders submitted after bar t can fill no earlier than the configured execution point on bar t+1. The engine cannot determine whether arbitrary user-supplied datasets, features or preprocessing pipelines contain future information.

Does it support point-in-time universes?

The engine does not currently provide a first-class historical membership model with effective start and end dates. Users can supply point-in-time membership data and prevent inactive instruments from receiving signals or target weights. A current constituent list must not be treated as historical membership.

How are fundamental reporting lags handled?

QuantJourney does not infer publication dates or reporting lags. The supplied time index is treated as the date on which an observation became available, so fundamental inputs must be aligned to their actual publication or availability timestamp before entering a strategy. A fiscal period-end date alone is not sufficient.

What qualifies as true out-of-sample performance?

QuantJourney labels a result as per-fold out-of-sample execution only when each fold runs a fresh strategy instance, any parameter selection uses the training window, and the selected configuration is then frozen for the corresponding test window. slice_diagnostics results are explicitly labeled as in-sample diagnostics. Custom feature pipelines must still avoid fitting transformations on test data.

Are there ready-made strategies?

Yes. The strategy section includes guides for SMA crossover, momentum rotation, volatility targeting and Optuna optimization, and the repository ships with 50 runnable examples across weight, order and walk-forward workflows.

Can I copy and modify the strategy examples?

Yes. That is the intended workflow: run an example, understand the signal and weighting logic, then change the universe, indicators, costs, rebalance rules or validation settings for your own research.

Does my alpha leave my machine?

The library is local-first. Signals, weights, positions and reports are computed locally unless you intentionally use the hosted UI or external data services. Cloud data can feed the run without moving your research logic into someone else's engine.
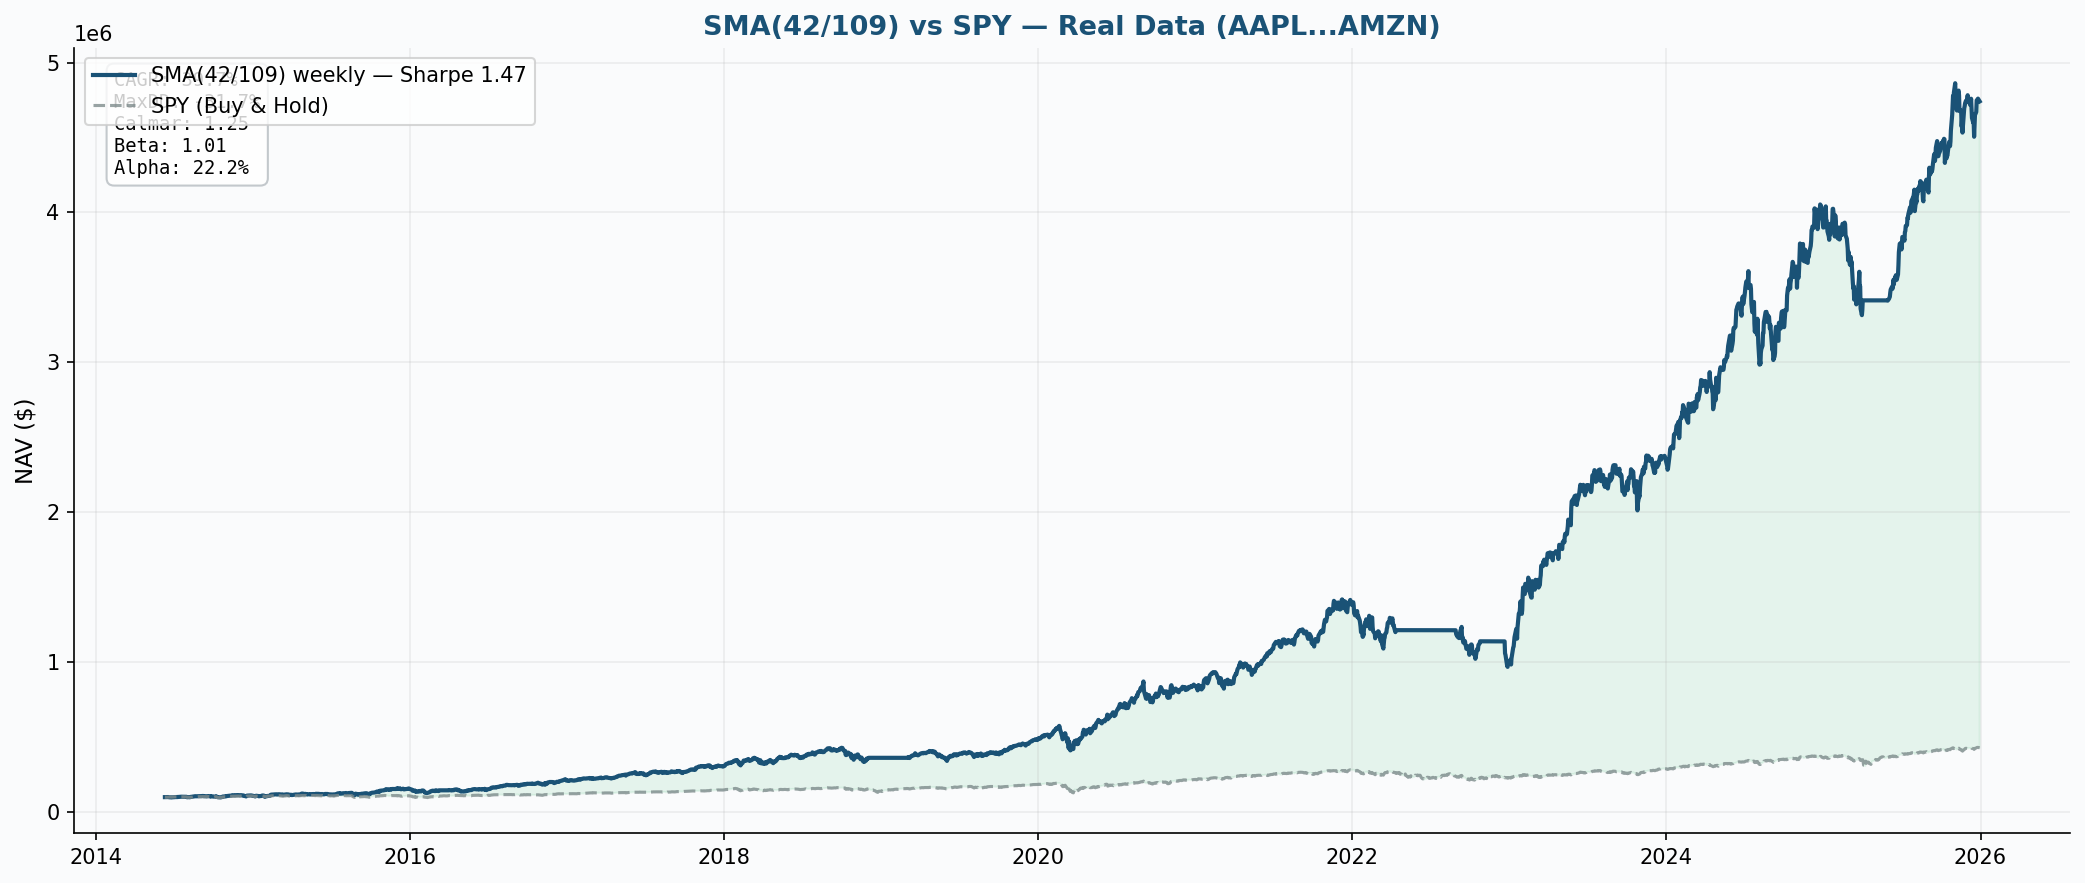
An equity curve is the outcome. The assumptions are the research.

Keep writing strategies in Python. QuantJourney Backtester makes the path inspectable—from data and indicators through signals, weights or orders, timing, rebalancing, costs and risk—then saves the result as local metrics, CSVs, plots and an HTML report you can review and rerun.