Which signal is doing the work?
When several signals feed one model, "which one matters?" has three common answers — permutation importance, drop-column importance, and Shapley values — and on correlated signals they can disagree materially. This guide explains all three on the engine's four-signal panel and demonstrates exact Shapley R² attribution by refitting OLS across all feature subsets. The calculation is an in-sample methodology example, not model-based SAGE and not an out-of-sample feature-selection verdict. It is the companion to signal quality — that guide grades signals one at a time; this one explains how shared fitted performance can be allocated in combination.
The current example implements exact Shapley R² attribution by refitting an OLS model for every feature subset. It is not model-based SAGE. SAGE for fixed fitted models, fold-aware loss attribution and uncertainty estimates is on the QuantJourney research roadmap and is not available in the current open-source or hosted engine.
The question is harder than it looks
Isolated, each signal has an information coefficient. Combined, they share and overlap — and the moment two signals carry the same information, "how important is each?" stops having an obvious answer.
The four signals from the signal-quality guide are not independent. On the eight-ETF monthly panel, the SMA-trend signal and 12-month momentum correlate at ρ = 0.72 — unsurprising, since a rising trend and positive trailing momentum are two views of the same phenomenon. Low volatility overlaps both at 0.30–0.45. Short-term reversal is the least-correlated input in this sample:
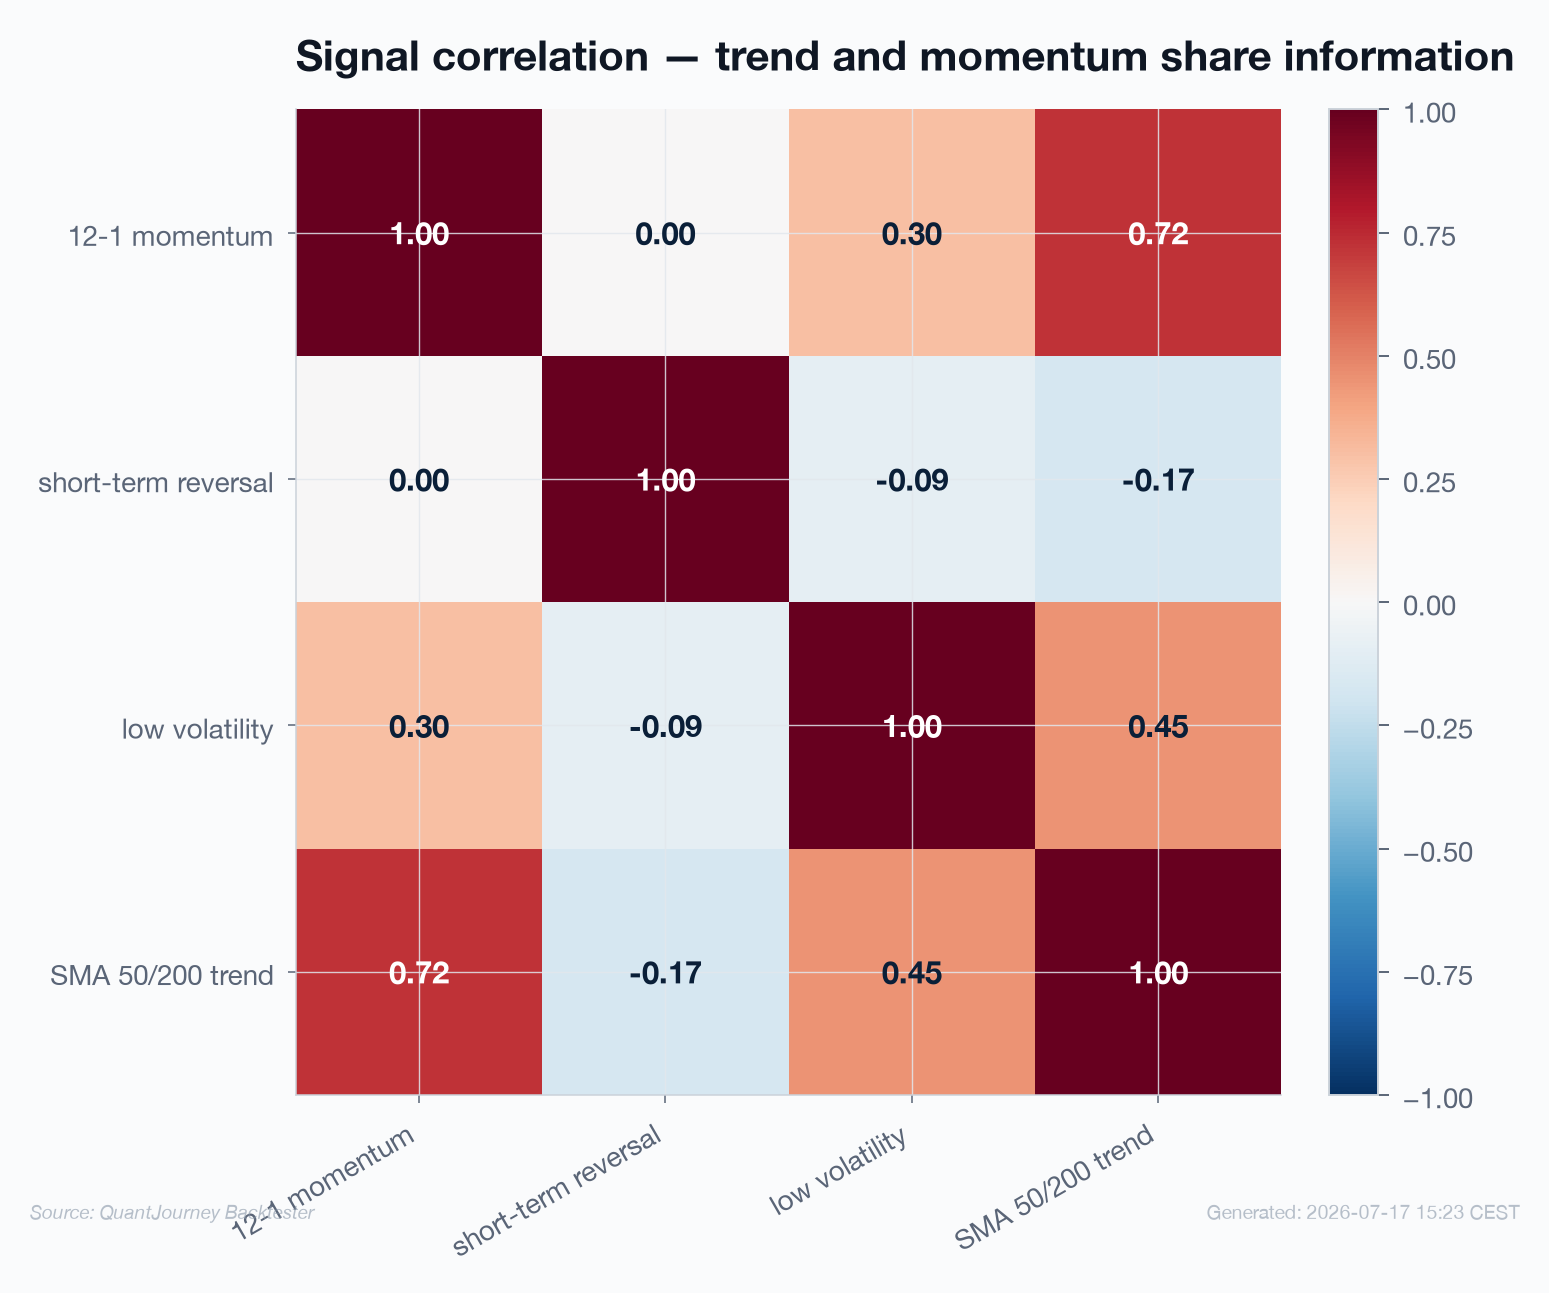
Correlation is why the question is subtle. If two signals are near-duplicates, is each half as important, or is each fully important because either could carry the load? The answer you get depends entirely on how you ask — so each method must be interpreted as an answer to its own precisely defined question.
Attribution starts with a value function
Every attribution method is really a game: features are players, and the payoff is a chosen fit or evaluation score. Fix the payoff and evaluation sample first, and the methods become comparable.
Define the value of a coalition as the standard in-sample R² of an OLS model refit on just those features — zero for the intercept-only empty set, and the full fitted-sample R² for all features:
import numpy as np
from itertools import combinations
from math import factorial

# Value function: standard in-sample R² of an OLS model refit on subset S.
def v(S: tuple[int, ...]) -> float:
    if not S:
        return 0.0
    A = np.c_[np.ones(len(X)), X[:, list(S)]]
    beta, *_ = np.linalg.lstsq(A, y, rcond=None)
    resid = y - A @ beta
    ss_res = resid @ resid
    y_centered = y - y.mean()
    ss_tot = y_centered @ y_centered
    return float(1 - ss_res / ss_tot)
This particular value function is an OLS subset-refit game, commonly described as Shapley R² or LMG-style attribution. It decomposes explanatory fit inside the estimation sample. A production value function would fit every coalition on identical historical training folds, score it on the following held-out folds, and then decompose the aggregated out-of-sample score. The earlier published numeric snapshot used a non-standard zero-return denominator; it has been removed rather than relabelled as classical R².
Two fast answers that can diverge on correlated features
Permutation and drop-column importance are two methods people often reach for. They are fast and intuitive, but correlated features can make them answer different questions and produce very different rankings.
Permutation importance shuffles one feature's column and measures how much R² falls. Drop-column importance refits the model without the feature and measures the same:
In this panel, shuffling a member of the correlated trend/momentum pair can disrupt the fixed fitted model, while dropping it and refitting lets the remaining feature absorb some of its role. That explains why the diagnostics may diverge here; it is not a universal theorem that permutation always over-credits and drop-column always under-credits. The direction depends on the fitted model, feature dependence, evaluation sample and permutation scheme. Compare methods only after fixing one evaluation design.
Exact Shapley R² attribution
Shapley values provide a unique allocation once the cooperative game and its fairness axioms are fixed. Here the game is the in-sample R² of OLS models refit on feature subsets; that makes this Shapley R² attribution, not SAGE.
A feature's Shapley value is its average marginal contribution over every coalition it could join — not just the full model (drop-column) and not the full model with the rest intact (permutation), but the average across all subsets, weighted so every coalition size counts equally:
Averaging over all coalitions allocates shared fitted performance according to the Shapley axioms for this value function. It does not discover a model-free or uniquely “true” importance. With four features the calculation is exact over 16 coalitions; with many features, coalitions can be sampled, but the result still depends on the chosen value function and evaluation design:
# Exact Shapley values: a feature's average marginal contribution over
# every coalition it could join. With 4 features that is 2^4 = 16 subsets
# — exact and instant. (For many features you sample coalitions instead.)
F = range(n)
v_cache = {S: v(S) for k in range(n + 1) for S in combinations(F, k)}

shapley = np.zeros(n)
for j in F:
    others = [i for i in F if i != j]
    for k in range(len(others) + 1):
        for S in combinations(others, k):
            w = factorial(len(S)) * factorial(n - len(S) - 1) / factorial(n)
            shapley[j] += w * (v_cache[tuple(sorted(S + (j,)))] - v_cache[tuple(sorted(S))])

# Efficiency holds for the chosen value function:
assert np.isclose(shapley.sum(), v_cache[tuple(F)] - v_cache[()])
The key accounting property is efficiency: the Shapley values sum exactly to the full model's in-sample R² minus the intercept-only baseline. This is an exact decomposition of the chosen fitted-sample value, not proof that the same contributions persist out of sample:
What this attribution can — and cannot — decide
In-sample attribution explains the fitted model. It does not by itself select production features or allocate capital.
# Two comparison diagnostics on the SAME evaluation design.

# Permutation importance: shuffle one column, measure the R² drop.
perm[j] = v_full - mean(v_full_with_column_j_shuffled)

# Drop-column importance: refit the model without the column.
drop[j] = v_full - v(all_features_except_j)

# Correlated features can make these diagnostics diverge. The direction
# is not universal: it depends on the model, data and permutation scheme.
# Shapley allocates the chosen coalition value according to its axioms.
A less-correlated signal may receive more Shapley credit than a member of a redundant pair because its average marginal contribution across coalitions can be larger. That is a property of this coalition game, not proof that the signal generalizes or supplies an independent live return stream.
Feature pruning and capital allocation therefore must not rest on the in-sample ranking shown by this method. They require identical blocked or walk-forward folds for every coalition, out-of-sample scoring, stability across folds and an explicit multiple-testing policy. The exact subset calculation here demonstrates attribution mechanics only.
These values attribute one OLS subset-refit game on one estimation sample. Change the model, folds, loss or missing-feature convention and the values can change. The right reading is never “feature X is important in the abstract,” but “feature X received this allocation under this value function and evaluation design.” SHAP and model-based SAGE are distinct games with distinct missing-feature semantics; neither is produced by the example above.
Attributing a multi-signal model honestly
Five rules that keep feature attribution from lying to you.
Check the correlation matrix first
Attribution is only subtle when features overlap. If your signals are near-orthogonal, all three methods agree and you can use the cheapest. The 0.72 trend/momentum correlation is what makes this panel interesting.
Compare methods under one design
Permutation and drop-column can diverge when features overlap, but the direction is not universal. Hold the model, evaluation sample and permutation scheme fixed before comparing them.
Name the Shapley game precisely
This example is exact Shapley R² attribution with OLS subset refits. Efficiency means the parts sum for that value function; it does not make the allocation model-free or turn it into SAGE.
Validate before pruning
Use identical blocked folds for every coalition and decompose held-out performance before feature-selection or capital-allocation decisions. In-sample ranking is a diagnostic, not a deployment gate.
Re-attribute when the game changes
Change the model, loss, folds or missing-feature semantics and the allocation may change. Record the full value function with every result.
References
- Shapley, L. S. (1953). A Value for n-Person Games. Contributions to the Theory of Games II — the original axioms and the efficiency property.
- Lundberg, S. & Lee, S.-I. (2017). A Unified Approach to Interpreting Model Predictions. NeurIPS — SHAP, per-instance Shapley attribution.
- Covert, I., Lundberg, S. & Lee, S.-I. (2020). Understanding Global Feature Contributions With Additive Importance Measures. NeurIPS — model-based SAGE and its distinction from subset-refit attribution.
- Lindeman, R. H., Merenda, P. F. & Gold, R. Z. (1980). Introduction to Bivariate and Multivariate Analysis. — subset-model Shapley decomposition of regression R² (LMG).
- Breiman, L. (2001). Random Forests. Machine Learning 45(1) — permutation importance and its bias under correlated predictors.
- Strobl, C. et al. (2008). Conditional Variable Importance for Random Forests. BMC Bioinformatics 9 — why correlated features distort naive importance.